Journey Engagement
The Journey Engagement analytics report gives recruiters an overview of the performance of the Journey communications that have been set up for their candidate pools.
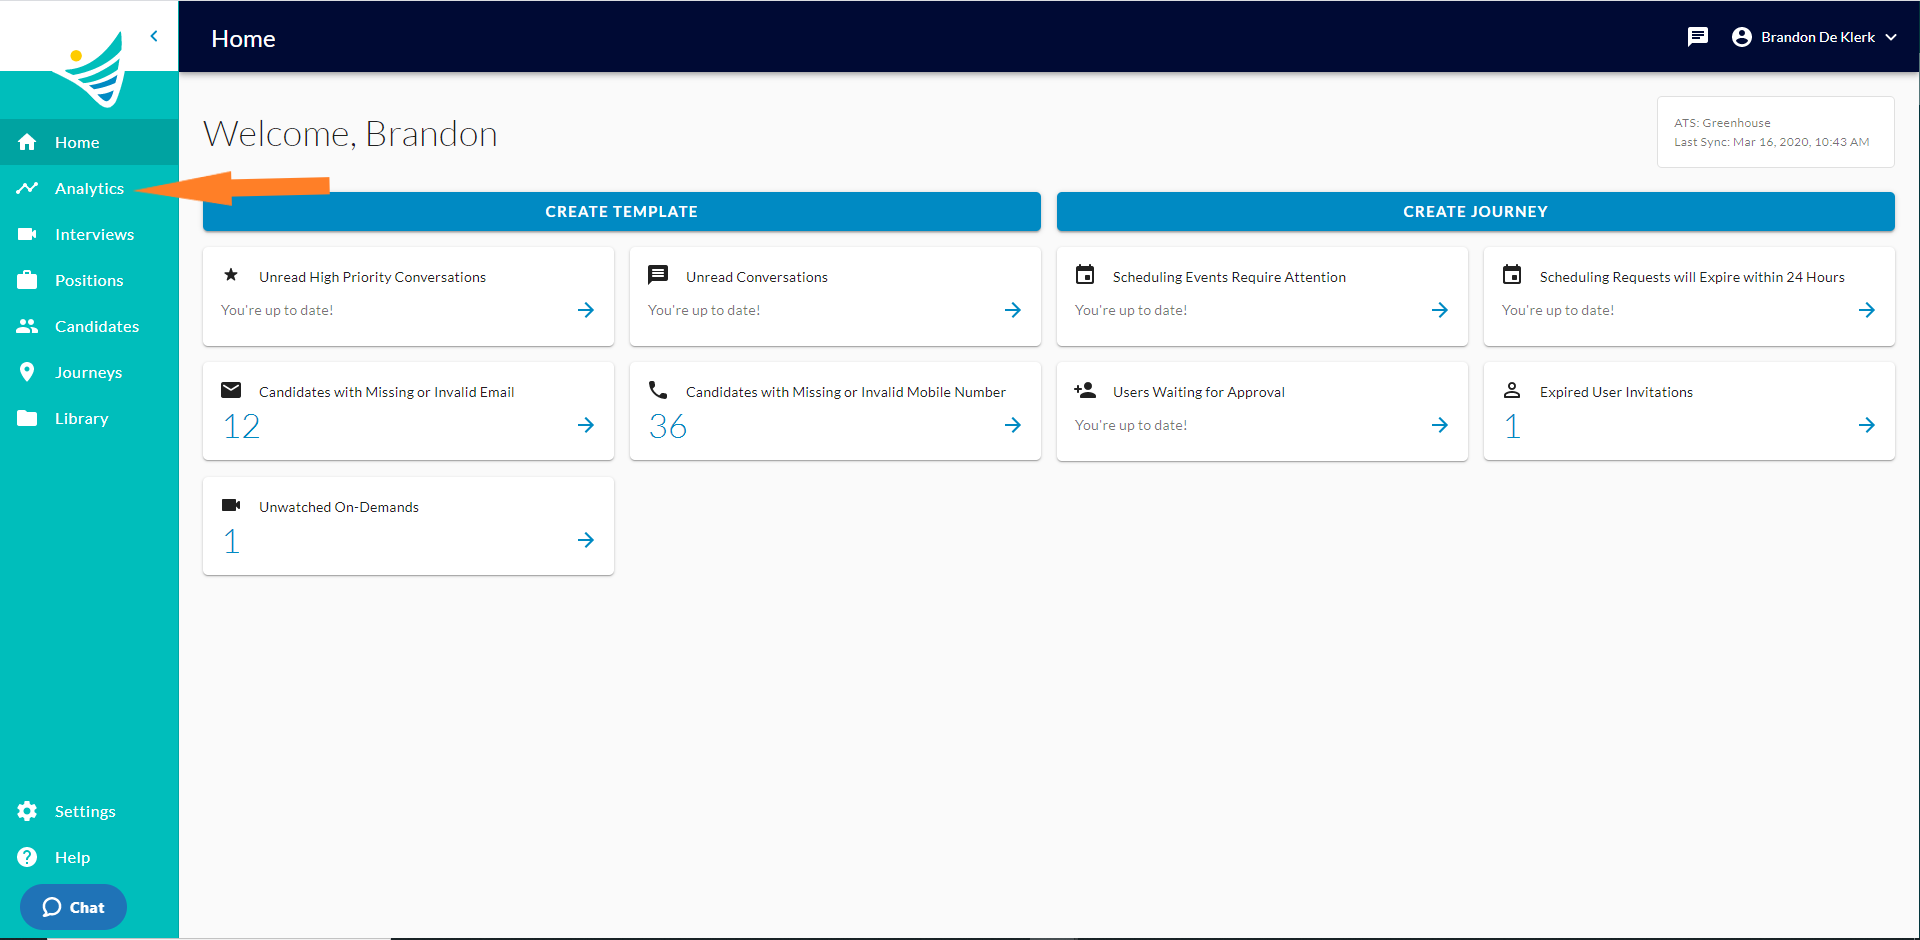
To get to the Journey Engagement page you will click on the "Analytics" tab on the left-hand side of the page.
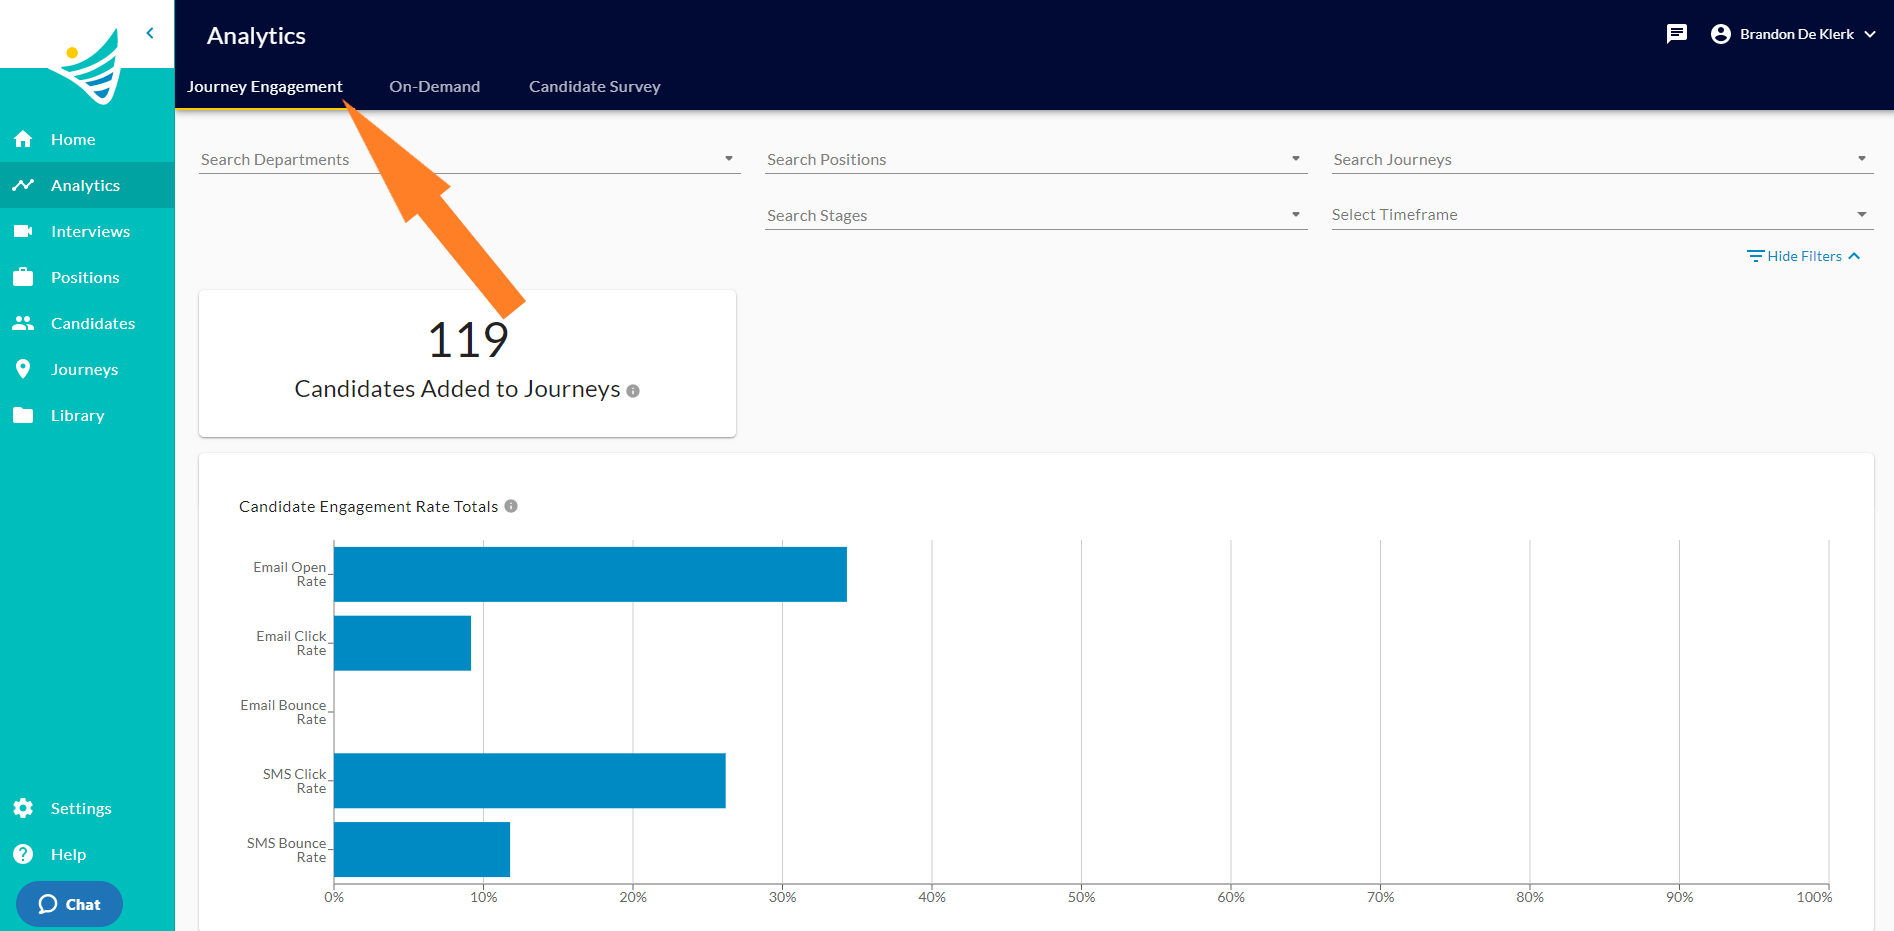
Next, you will click the "Journey Engagement" tab on the top right-hand side of the page.
Report Filters
The graphs can be filtered based on how the recruiter wants to view the data. They can be filtered based on the combinations of:
- Department
- Position
- Stage
- Journey
- Time Frame
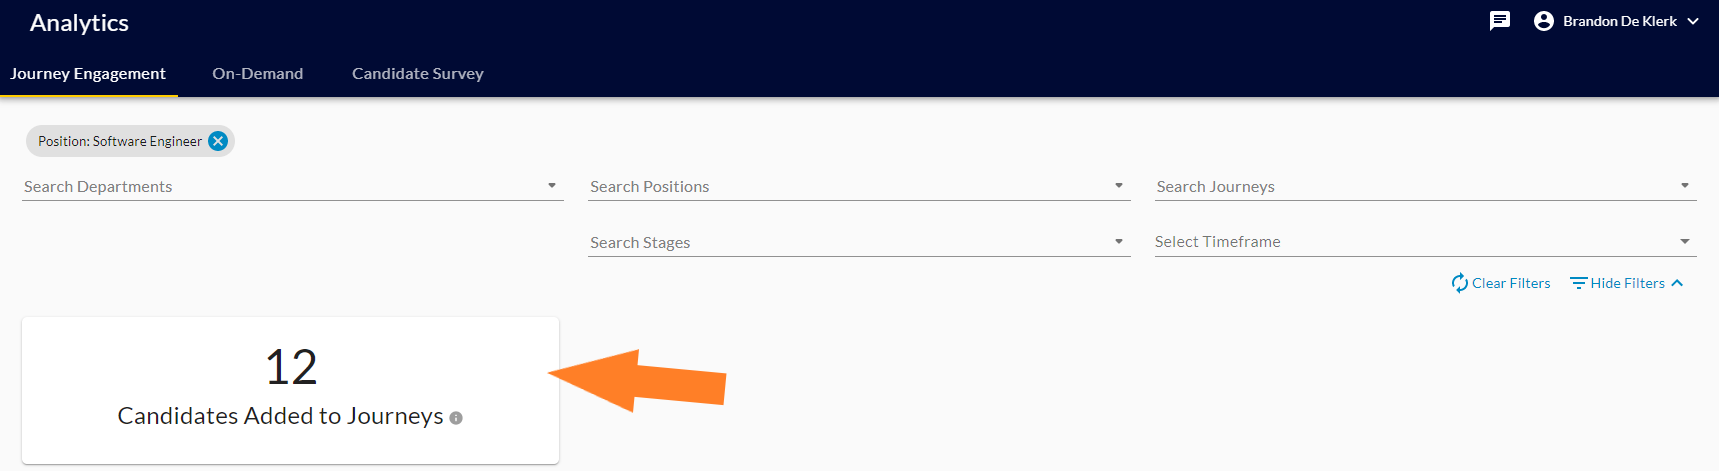
Once you filter by any of the filters given you will be shown different pieces of information.
Candidates Added to Journeys
This card displays the total number of candidates that have been added to Journeys over time
Candidate Engagement Rate Totals
This graph provides key metrics on the performance of the communications that have been sent to candidates through journeys.
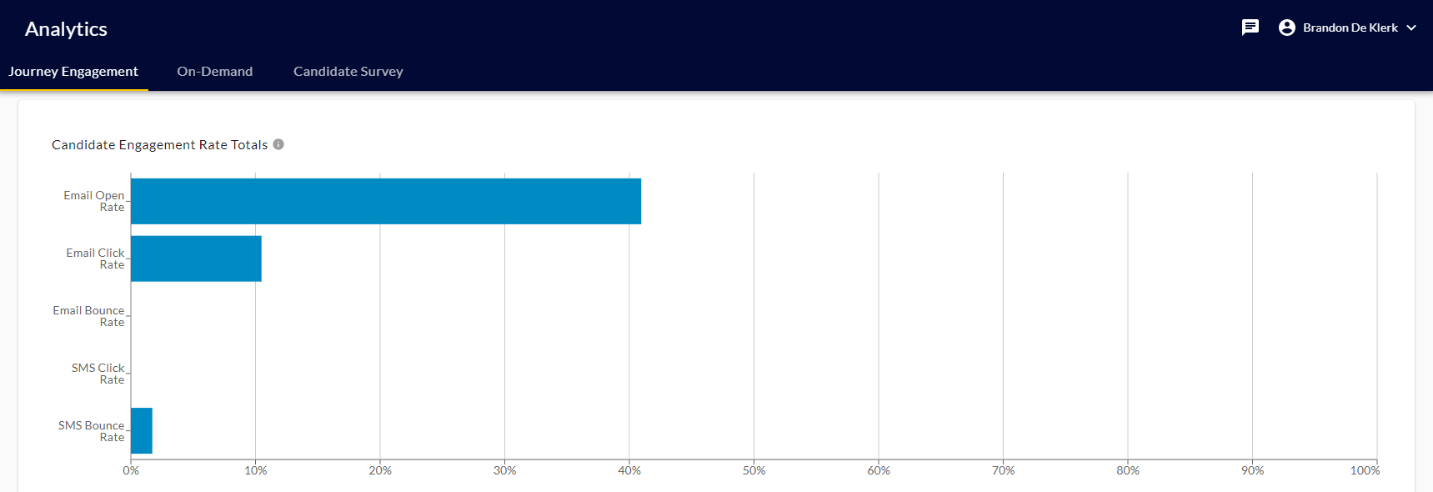
Email open rate: The number of unique emails opens for all emails sent within the selected time period. This is an indicator of how likely your candidates are to open an email. Update subject lines in order to optimize email open rates.
Email click rate: the number of unique email clicks for all emails sent within the selected time period. This is an indicator of how likely your candidates will click on a link within your email. Update your CTA's and link labels in order to optimize click through rates.
Email bounce rate: number of unique email bounces for all emails sent within the selected time period. This is an indicator of the quality of the data you have. High bounce rates may indicate you have invalid emails in your system of record.
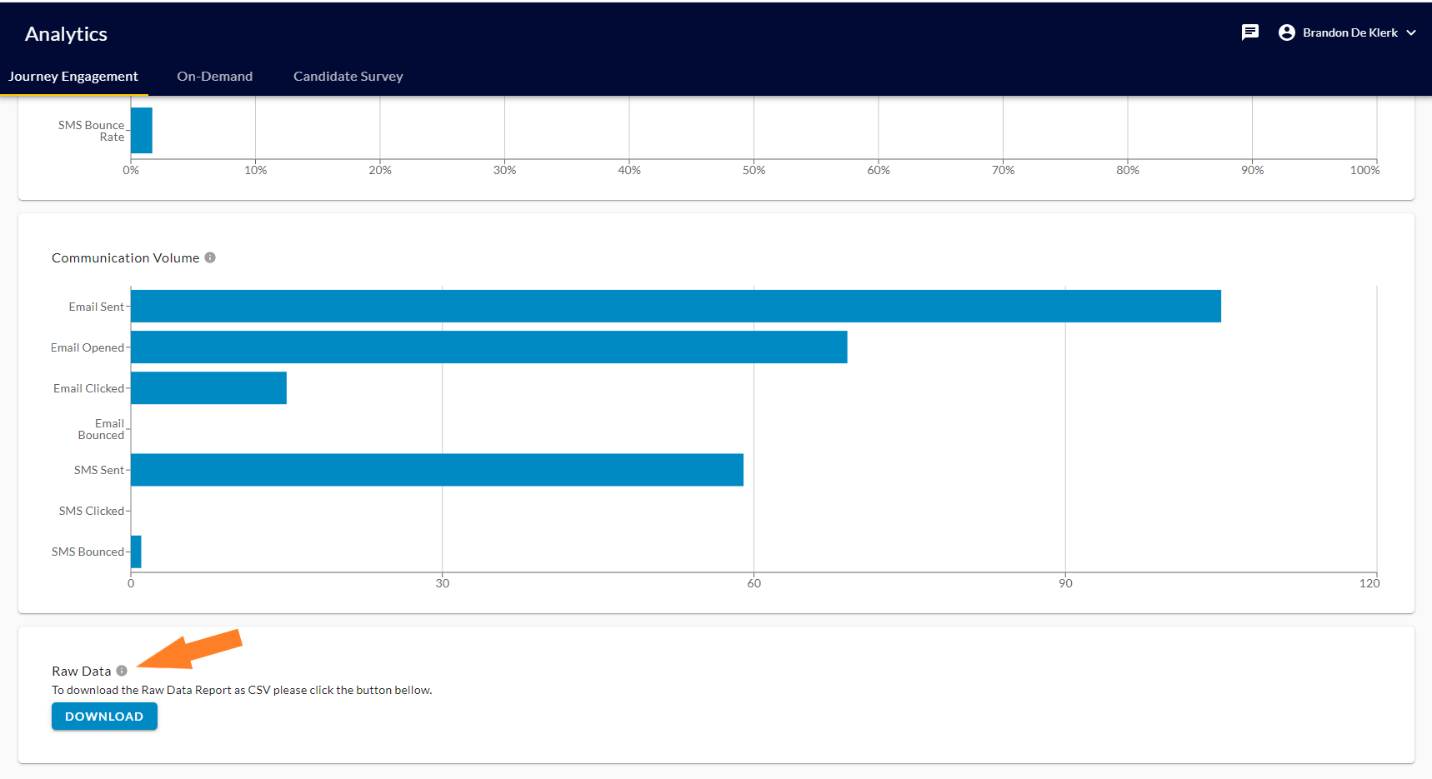
Communication Volume
The communication volume graph shows the total number of communications and total aggregate engagement by channel over time.
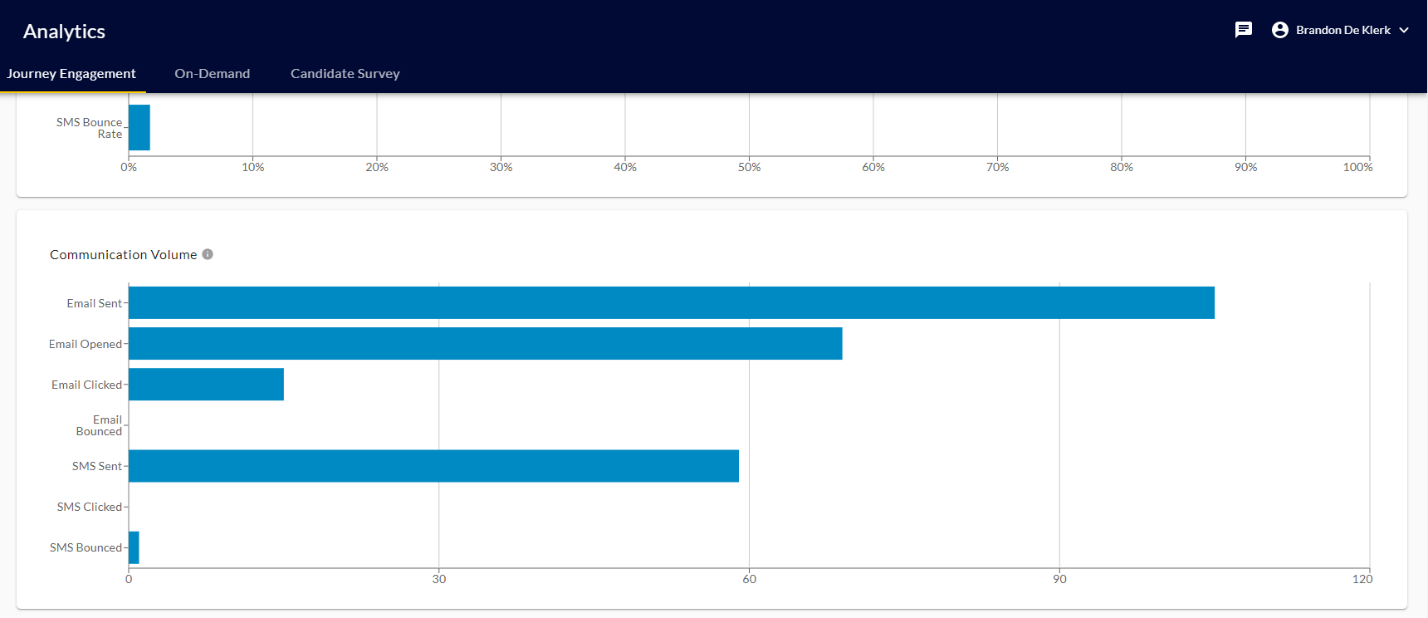
Emails Sent: Total number of email communications sent via Journeys
Emails Opened: Total number of email opens for emails sent via Journeys
Email Bounced: Total number of email bounces for emails sent via Journeys
SMS Sent: Total number of SMS communications sent via Journeys
SMS Clicked: Total number of SMS clicks for SMS sent via Journeys
SMS Bounced: Total number of SMS bounces for SMS sent via Journeys
Raw Data Report
The raw data report includes the full list of journey related events that can be downloaded as CSV. This data can be used to do more custom or advanced reporting by customers themselves.