Custom Dashboards
Custom Dashboards, also referred to as Explore, allows users to create their own dashboards, reports and visualizations. By selecting fields from the field list, users can define their own filter sets, sort order, pivot tables, and desired type of visualization.
Custom Dashboards requires Tier 2 (Standard) or Tier 3 (Premium) privileges. See Advanced Analytics: Team Privileges for details on permission tiers.
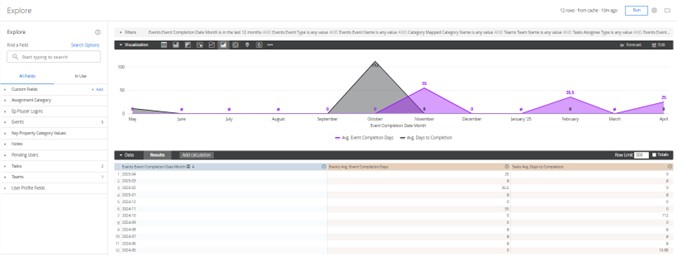
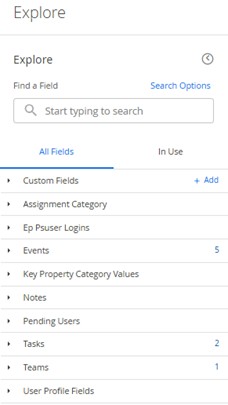
Fields
Fields in Custom Dashboards are categorized data points where you can select anything from names, locations, events, teams, tasks and more. You can select any field from your desired topic(s) to add to the data results or as a filtered item. This allows you to create your own custom dashboard and/or report. The numbers to the right of the section represent how many fields from that section are currently in use for the custom dashboard.
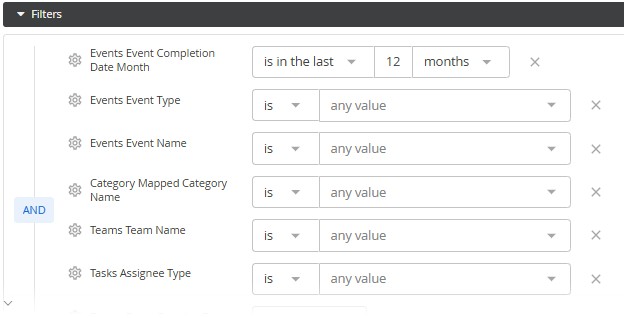
Filters
Filters allow you to drill down into the details and select value(s) to better segment the specific results you're trying to create. Like the Dashboard filters, you can determine the outcome of your data based on specific data points.
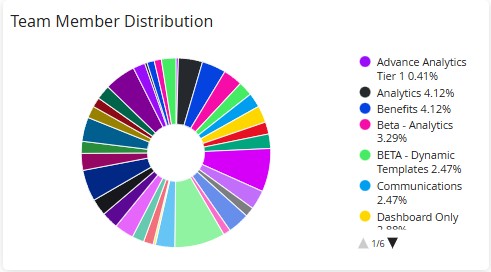
Visualizations
A Visualization is a graphical representation to visualize and analyze organizational data. Adjust how you want to see your data — make a bar graph, pie chart, funnel, or multiple other visual representations.
Data
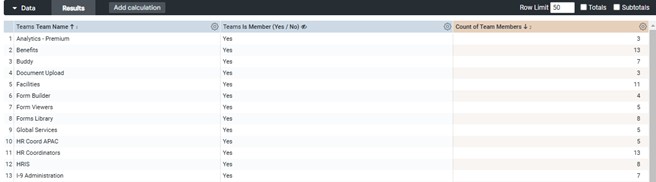
The data view shows the result of selected filters in a Smart Table or Custom Dashboard. Having powerful data to represent your business performance allows you to mold the desired visualizations. You can create your own reports providing tangible data on the success and opportunity areas within your workflow journeys.
How to build a Custom Dashboard
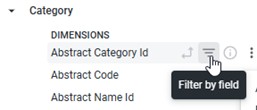
- Add, remove, or update fields in the filter section by selecting the Filter by field option, or from the Options wheel in the Data area.
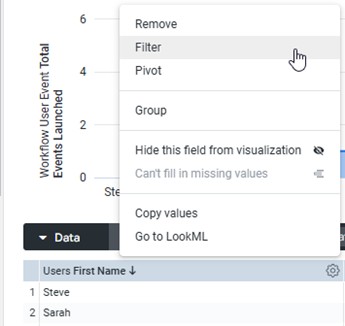
- Add as many columns of data as needed to create custom dashboards or reports for events, users, tasks, teams, and more.
- Combine all of the information together, or create and save separate reports for specific users.
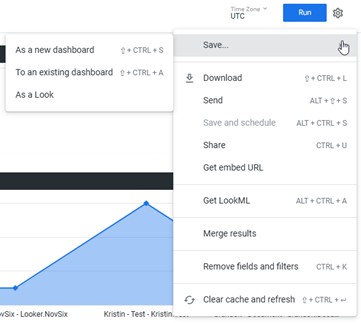
Leverage the Tier 3 (Premium) privilege for advanced capabilities including scheduling automated reports, creating alerts, and sending data to external integrations (S3, SFTP, webhooks).