Quick Stats (Legacy)
Note (Legacy): Quick Stats may not be available in all configurations. This feature may be deprecated depending on your organization's setup. Contact your administrator for availability.
The Quick Stats dashboard provides quick access to the information you need to transform data into action, identify patterns, track task completion, and more. What's more, the data is presented as charts, graphs, and tiles for "at-a-glance" efficiency.
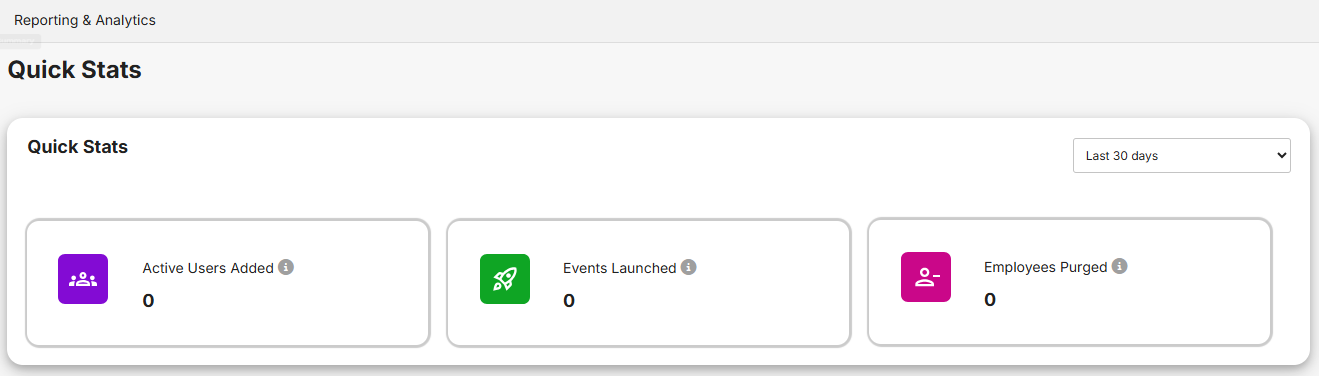
Charts, graphs, and tiles
Here's a summary of each chart, graph, and tile on the dashboard and what they do.
| Chart/graph/tile | Description | Filter |
|---|---|---|
| Active Users Added | Shows a count of all newly-created users in Rival Workflow during the time period selected in the Days filter. | Last 30 days Last 60 days Last 90 days Last 6 months Last 12 months |
| Events Launched | Shows a count of all events launched during the time period selected in the Days filter. | Last 30 days Last 60 days Last 90 days Last 6 months Last 12 months |
| Employees Purged | Shows a count of all employees purged during the time period selected in the Days filter. | Last 30 days Last 60 days Last 90 days Last 6 months Last 12 months |
| Events Launched This Year | Shows the number of events launched per month since the beginning of the year. Filter defaults to all events but you can select a specific event. Data is presented as a bar chart. | All events Select a specific event |
| Dashboard Summary | A collection of tiles that provides a count of employee tasks, assignee tasks, team tasks, and my tasks (tasks of the logged-in user). Tasks are color-coded based on status: Overdue, At risk, and On track. Click a link to go to the Dashboard Summary. | |
| I-9 Statistics | A slimmed down version of the I-9 Dashboard. Click the I-9 Advanced Search link to open the I-9 Search page. Note: I-9 Statistics only appears on the Homepage Analytics dashboard if you are on a team that has the I-9 Reports privilege. |
Settings and privileges
The Enable Analytics setting controls whether the Analytics Summary feature is available on your system. By default, the setting is off. When it's enabled (turned on), Analytics Summary is available for users who have the appropriate privileges.
Privileges control access and some functions of Analytics Summary.
| If you are on a team with this privilege: | Then: |
|---|---|
| Dashboard | You have access to the Dashboard Summary:
And see the Dashboard Summary section on the Analytics Summary dashboard (if you also have the Analytics privilege). |
| Analytics | You have access to the Analytics Summary dashboard:
And the Analytics Summary dashboard shows the Quick Stats and Events Launched This Year sections (and the Dashboard Summary section if you also have the Dashboard privilege). |
| I-9 Reports | The I-9 Stats section appears on the Analytics Summary dashboard. Otherwise, it is hidden on the dashboard. |
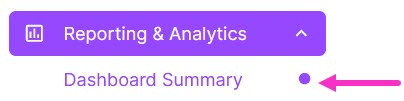
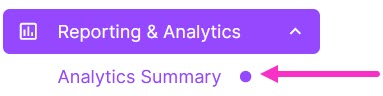
Access and view Analytics Summary
- From the navigation bar, click Reporting & Analytics>Homepage Analytics. The Analytics Summary dashboard opens.
- Click tiles, bar charts, adjust filters to view the data you want.