Help CenterRecruitReporting & AnalyticsReporting & Analytics overviewQuick look: Reporting & Analytics UI
Filters
Filters appear at the top of a visualization. They are used to select a subset of data. Filters vary based on the visualization.
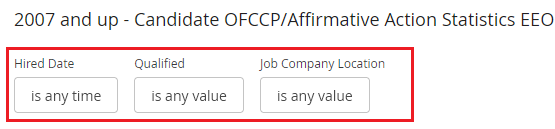
Click a filter to view and select an option:
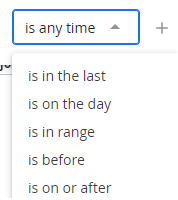
Date range filters have a plus sign. Click  to add "Or" date ranges.