Quick look: Reporting & Analytics UI
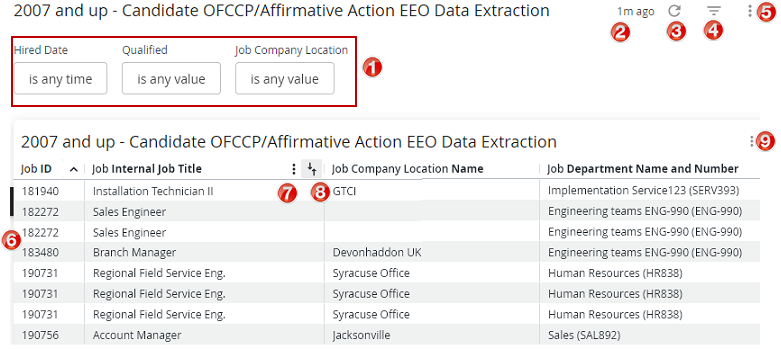
Here's a quick look at some key elements of the Analytics/Reports UI:
| Name | Description | |
|---|---|---|
| 1 | Filters | Filters are used to select a subset of data. Filters vary by report. Some filters:
|
| 2 | Last refresh | Shows when the report data was last refreshed. |
| 3 | Refresh | Click to refresh the report to get the most up-to-date data. |
| 4 | Show/hide filters | Click to show or hide filters. |
| 5 | Dashboard actions | Click  to view dashboard actions. to view dashboard actions. |
| 6 | Data grid | Shows the report data. |
| 7 | Column actions | Click on a column heading to view column actions. |
| 8 | Column sort | Click   to sort column in ascending or descending order. to sort column in ascending or descending order. |
| 9 | Tile actions | Click to view tile actions. |