Expectations dashboard
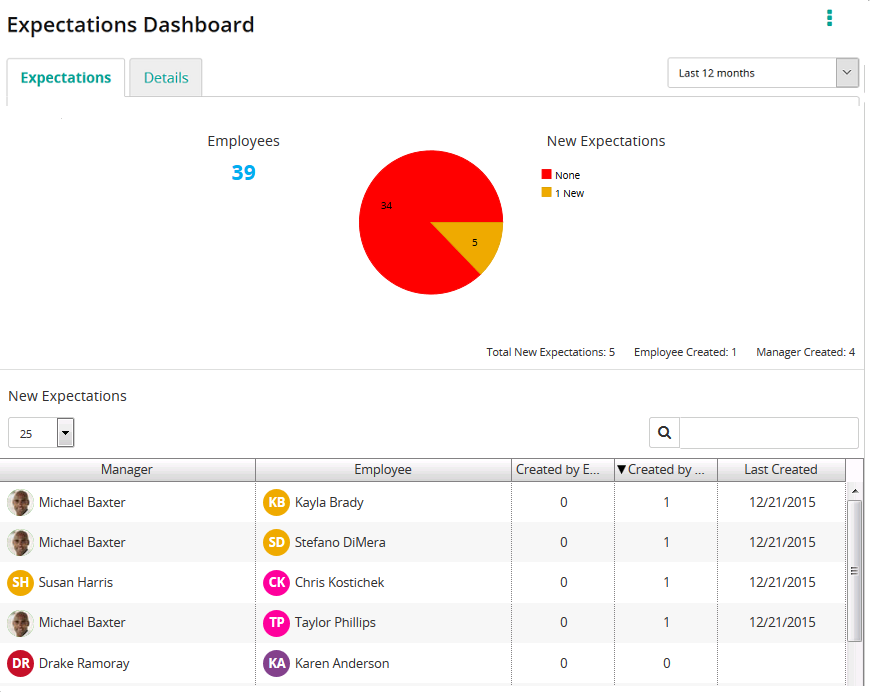
Use this dashboard to gain insights about how employees are using expectations within your organization. The pie chart, legend, and summary counts can help you identify the number of employees in your organization, how many of them have expectations, and whether those expectations were created by managers or employees.
The data grid provides details. Depending on what is selected in the pie chart, the grid shows those employees with new expectations or without expectations. Grid columns include employee, employee's manager, tally of expectations (employee-created or manager-created), and date expectation was last created.
The Details tab shows all the expectations, including the actual expectation text and when created and modified.