Engage dashboard
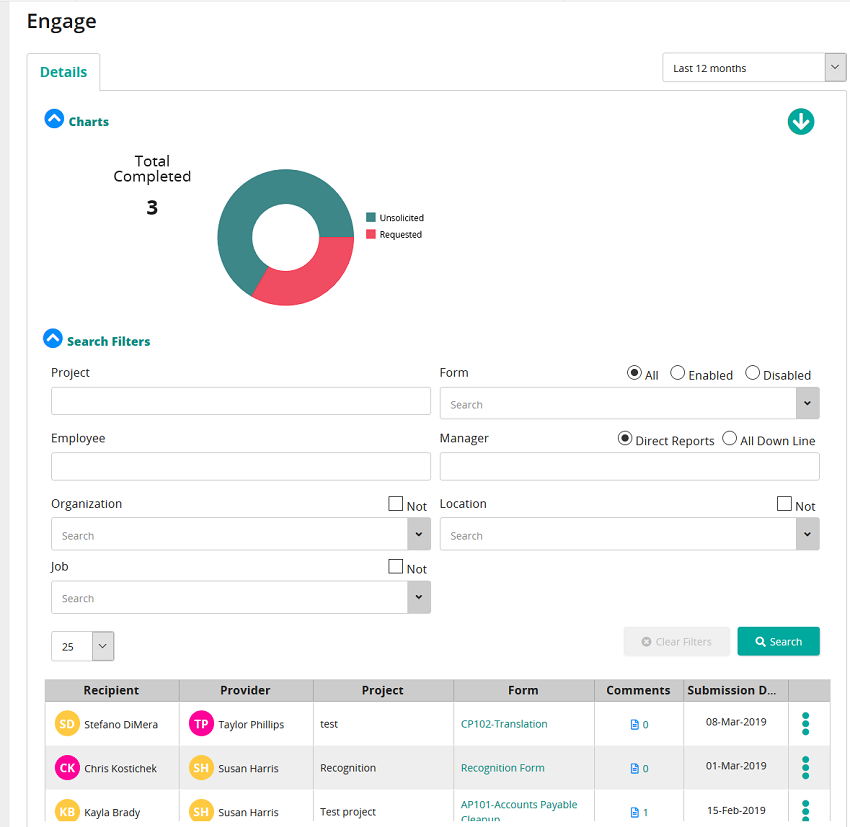
Use this dashboard to gain insights about how employees are using Engage. The pie chart, legend, and summary count show how many employees received unsolicited and requested feedback.
The data grid shows recipient, provider, project, form, number of comments, and submission date. Form and Comment columns contain active links that open the form.
Use filters to narrow data. Project filter is especially useful to limit data by project.