Goals dashboard
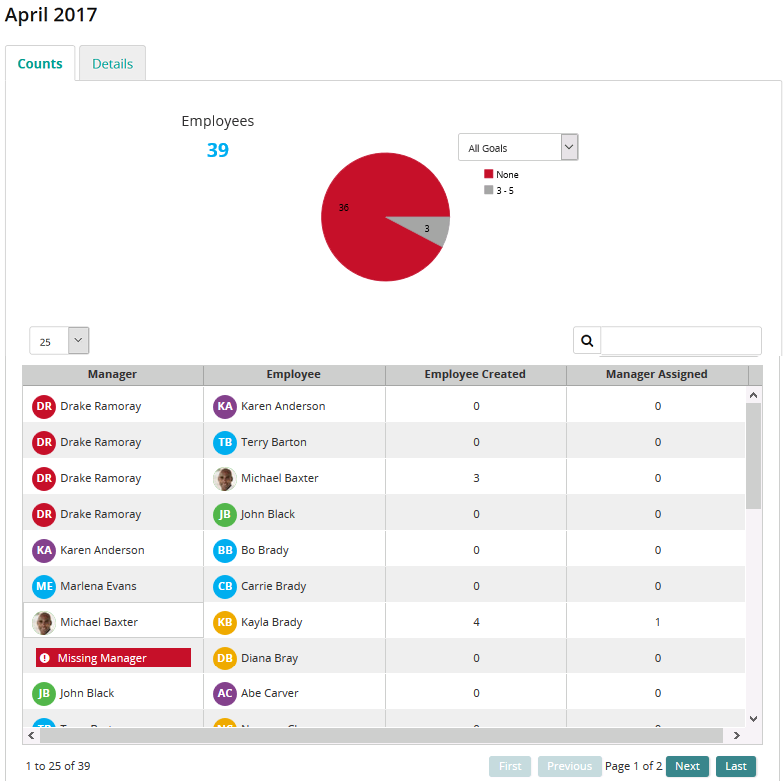
Use this dashboard to gain insights about how employees are using goals within your organization. The pie chart, legend, and summary counts help you identify the number of employees in your organization and determine how many goals have been created or assigned.
The dashboard is specific to the goal period you selected when accessing. You can filter to show all goals, manager assigned, or employee created.
The data grid provides details. Depending on what data wedge is selected in the pie chart, the data grid changes to show that data.
The Details tab shows all current goals (on track, at risk, and needs attention) and completed goals (personal goals and team goals).