Review dashboard
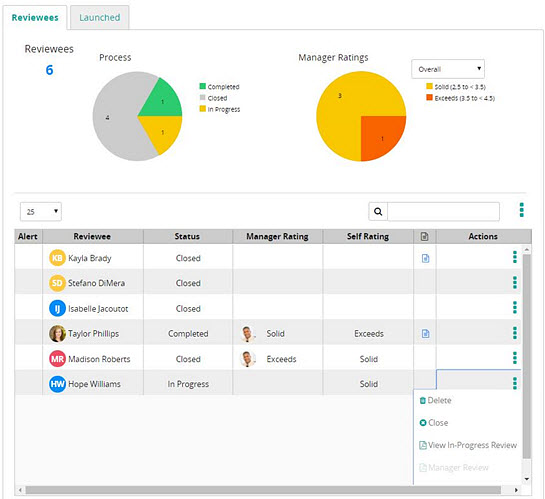
Use this dashboard to gain an overview of where reviewees are in the review process for a review.
Reviewees tab
The pie chart, legend, and summary counts can help you identify the number of reviewees along with their progress. The pie chart displays manager ratings for the overall rating and items that are rated on the review. Depending on what item is selected, the pie chart and grid change to show that data.
The data grid provides details. Depending on what data wedge is selected in the pie chart, the grid changes to show that data.
If an icon appears in the Alert column for a reviewee, hover your mouse over it to see what is wrong.
Launched tab
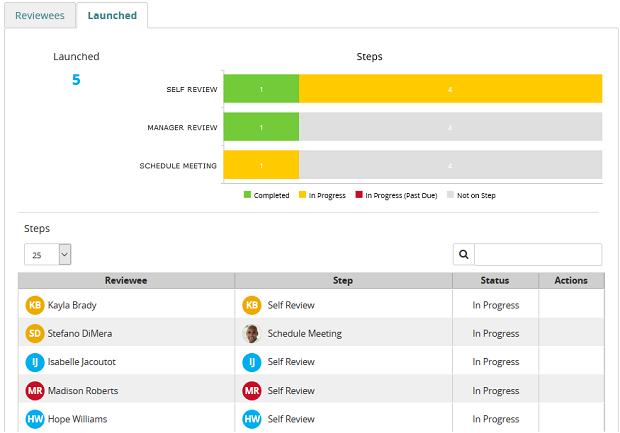
This tab shows the progress of reviews based on where they are in the workflow cycle (steps). Clicking a section in the bar chart displays that data in the data grid.